3RD TERM
Posted: Tue Jun 16, 2015 10:51 pm
SCHEME OF WORK
WEEK TOPIC
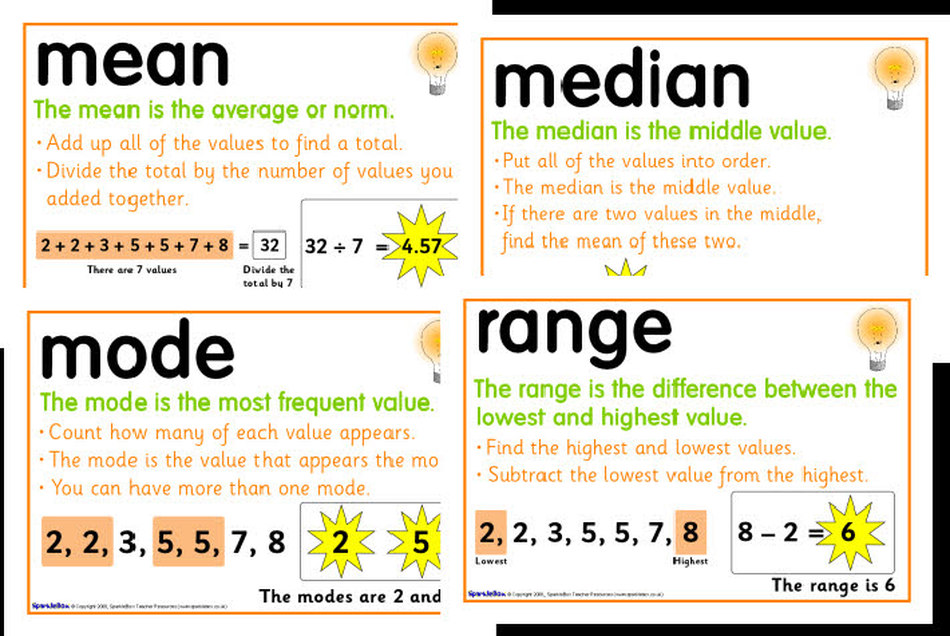
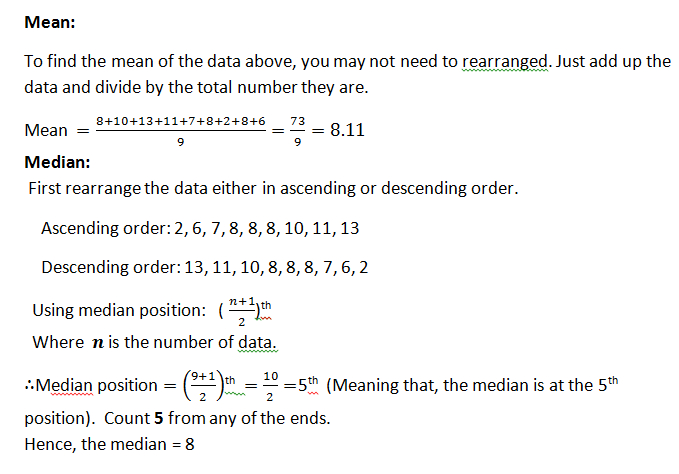
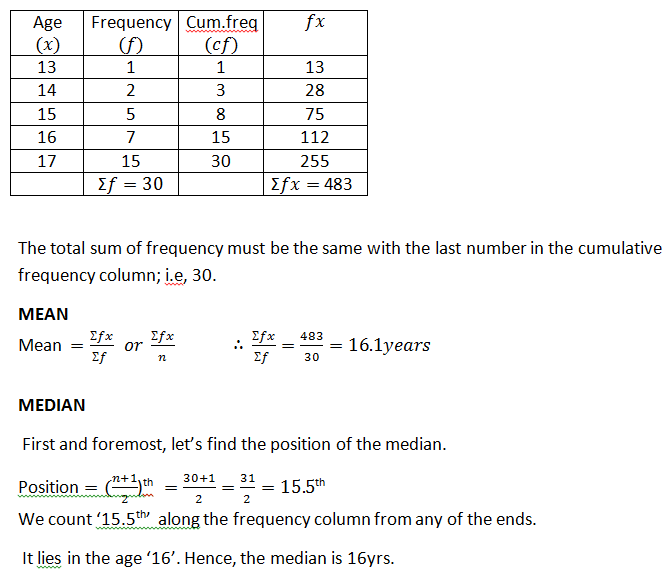
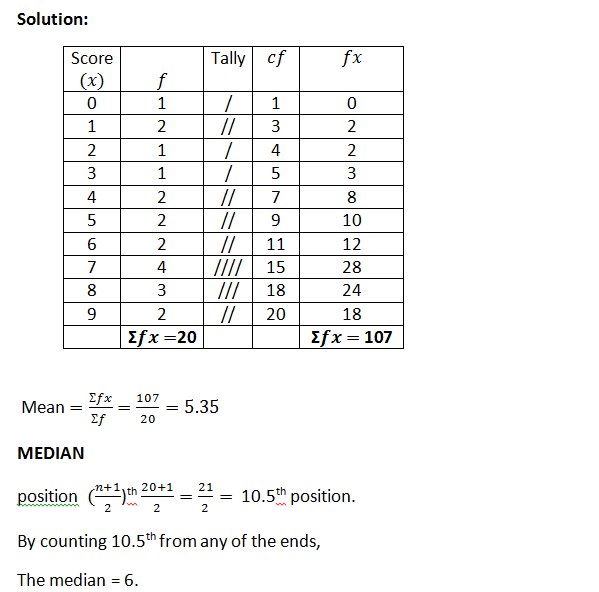
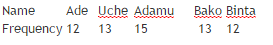
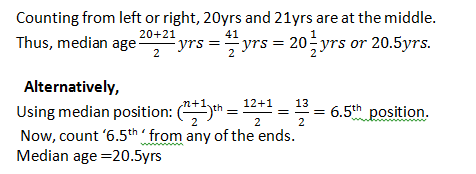
1. Measures of Central Tendency: Revision of previous work on mean, median and mode. Calculating the Median of a given data. Finding the Mode of given data. Calculate the Mean of any given data.
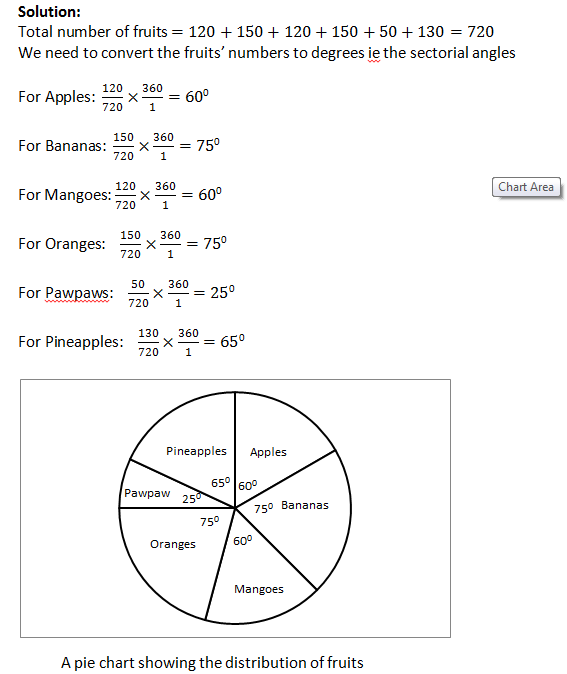
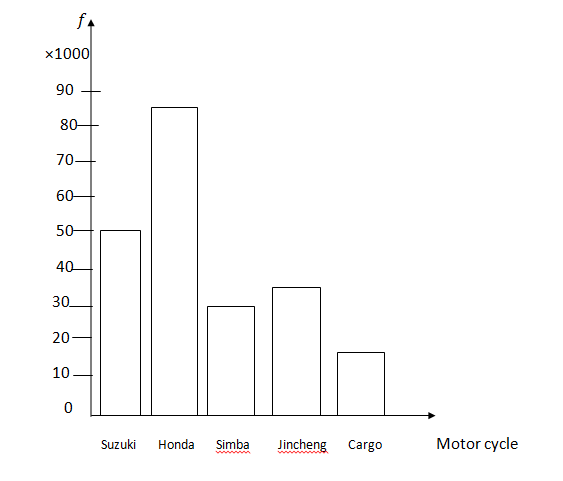
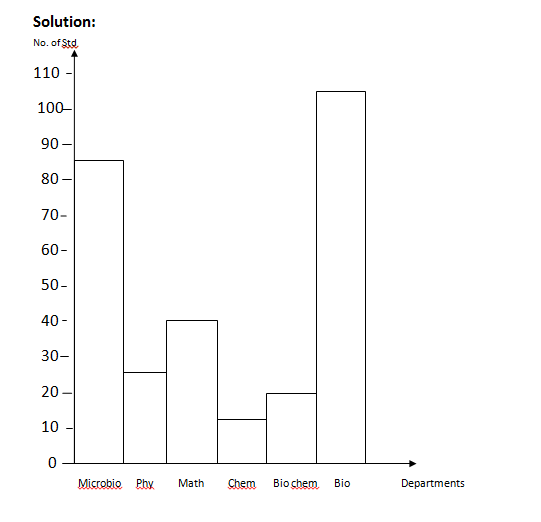
2. Data Presentation: Pie chart, Bar chart, Histogram - Representation of information on pie charts, Bar chart, etc.
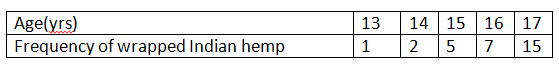
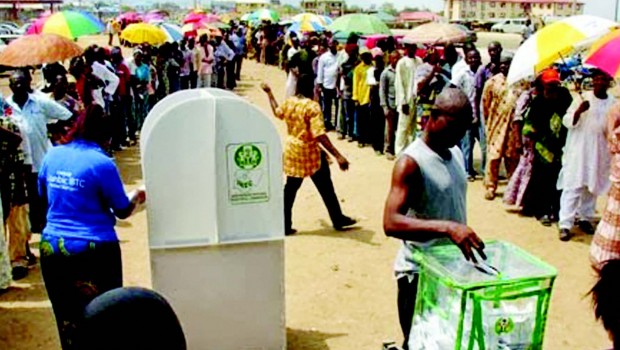
3. Use of measures of Central Tendency to analyze information on drug abuse. Meaning and importance of voting. Counting of votes. Analysis of voting using measures of central tendency.
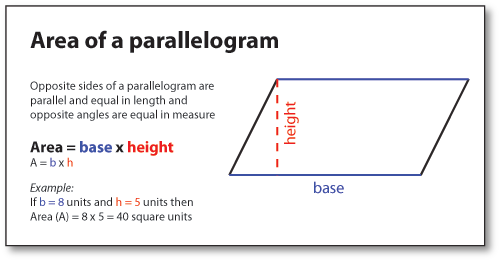
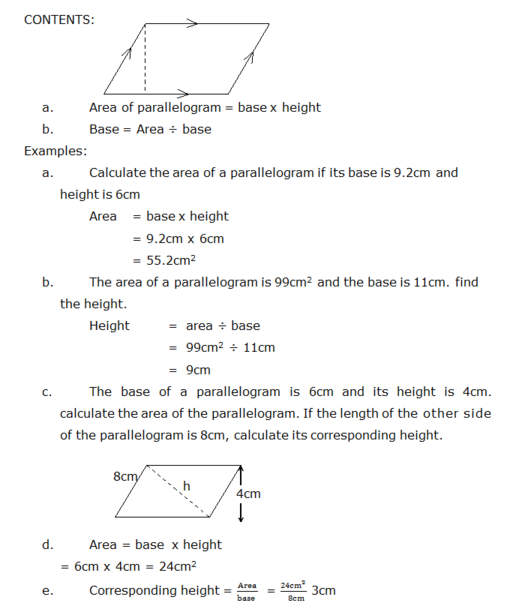
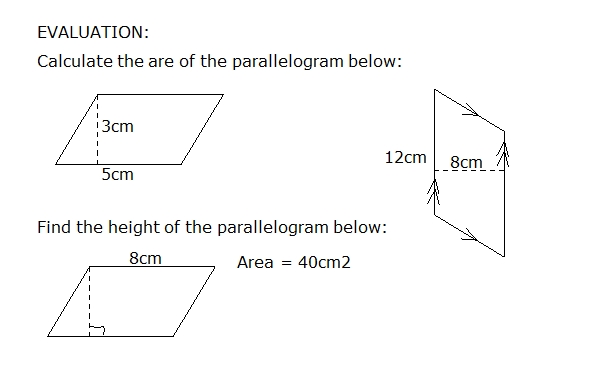
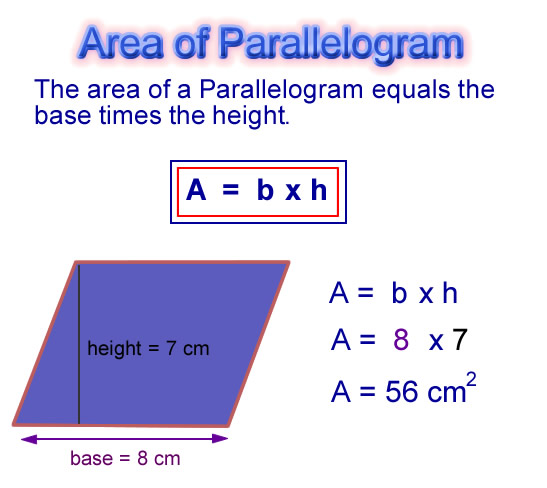
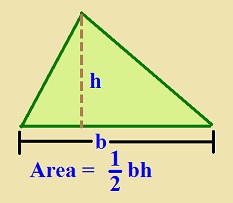
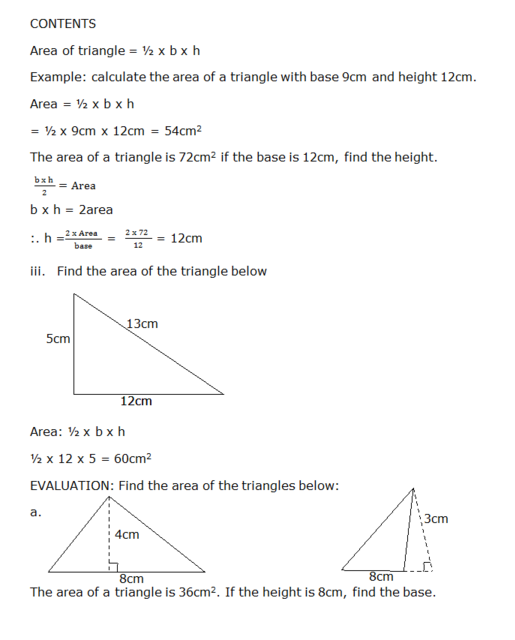
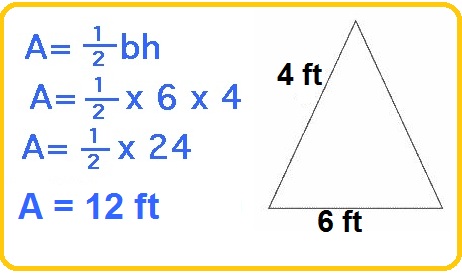
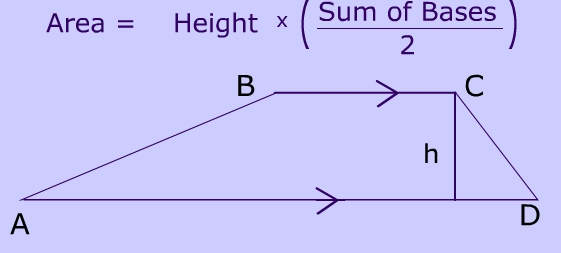
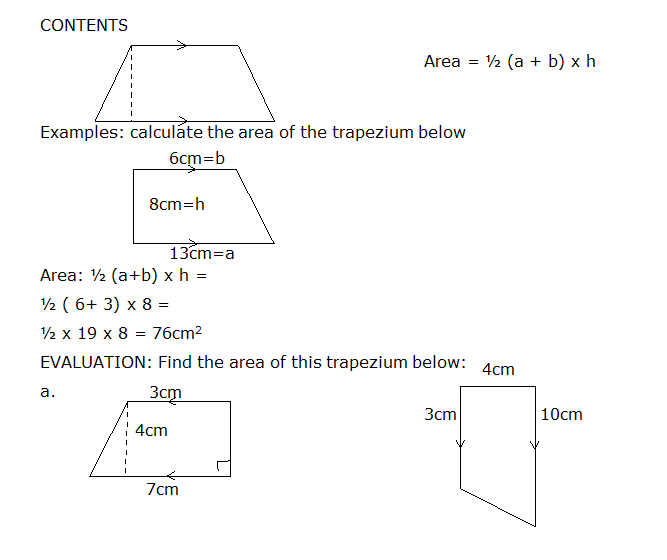
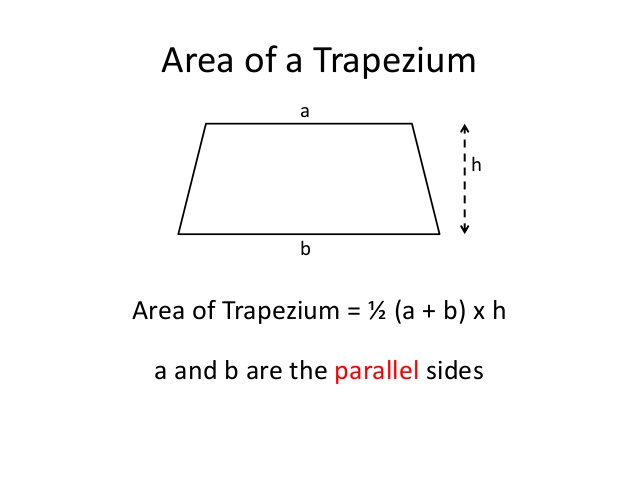
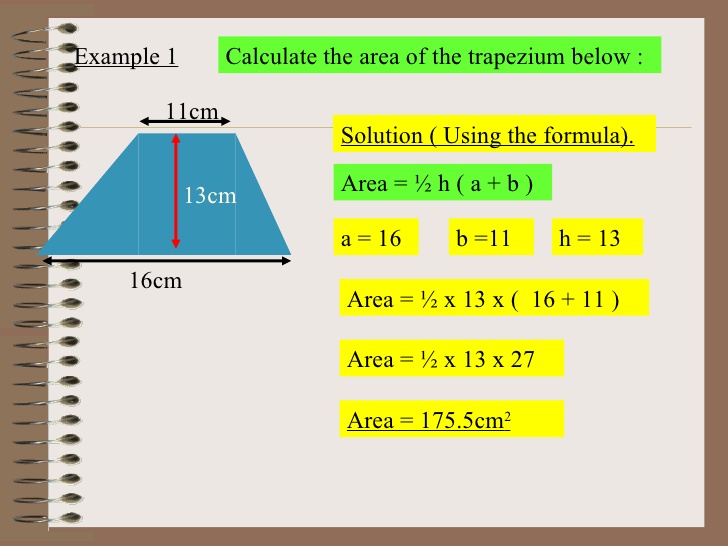
4. Areas of Quadrilaterals & Polygons
5-6. General Revision of Basic 7 – 9 works.
7. Mock BECE/JSCE.
8-12. Basic Education Certificate Examination (JSCE).
BASIC TEXT BOOKS:
1. New General Mathematics for Junior Secondary Schools Book 3. By M.F. Macrae et al.
2. Exam Focus: Mathematics for JSCE – By Donatus Igbokwe et al
3. Funtional Mathematics for JSS Book 3. By T.M Asiru et al
WEEK TOPIC
1. Measures of Central Tendency: Revision of previous work on mean, median and mode. Calculating the Median of a given data. Finding the Mode of given data. Calculate the Mean of any given data.
2. Data Presentation: Pie chart, Bar chart, Histogram - Representation of information on pie charts, Bar chart, etc.
3. Use of measures of Central Tendency to analyze information on drug abuse. Meaning and importance of voting. Counting of votes. Analysis of voting using measures of central tendency.
4. Areas of Quadrilaterals & Polygons
5-6. General Revision of Basic 7 – 9 works.
7. Mock BECE/JSCE.
8-12. Basic Education Certificate Examination (JSCE).
BASIC TEXT BOOKS:
1. New General Mathematics for Junior Secondary Schools Book 3. By M.F. Macrae et al.
2. Exam Focus: Mathematics for JSCE – By Donatus Igbokwe et al
3. Funtional Mathematics for JSS Book 3. By T.M Asiru et al